File Source
The file source may have up to 50 simultaneous outputs. The data cannot be stored in the source and is loaded from a text file during simulation. Only the file path is stored in the source. If you copy the drawing to another computer, you must also copy the data file. Be aware that the stored file path in the source may not be valid in another environment. The file path may be absolute (i.e. with drive letter) or relative. A relative path refers to the directory of the drawing.
Function: y(t) = f[P1...Pn, t] (per series)
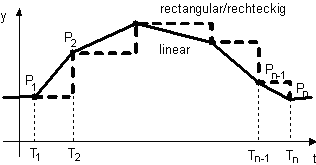
Every output signal requires an output node. The number of output nodes can be set in the block properties dialog box from 1 up to 50. The number of data series in the text file must at least match the number of output nodes. Surplus series are allowed but omitted. The output signals all start with the first point.
The characteristic can start with an initial value or the first point. The initial value is set by inserting a fictitious first point with time less than zero. The data value of this point applies from the very beginning up to the expiration of the start delay. After the start delay has elapsed, the value of the first real point is applied. If there is no fictitious point, the first real point applies from the beginning (before and after the start delay). The start delay shifts the whole characteristic to the right on the time axis. E.g. a point at time 2s comes at time 3s if the start delay is 1s.
The series are repeated each time the stored time interval has elapsed by setting Iterative. If the first point occurs at time 0, it is skipped in repetitions as the last point has priority.
If the simulation lasts longer than the stored sequences and repetitions, the last point is used as constant value for the rest of the simulation.
Description of the data format
The data streams and the associated time form a table. Columns are separated by tab, spaces or semicolons (or mixed). Valid decimal separators are period and comma. The first column contains the time values, all other columns the associated output values. All output values of a line are referred to the time value in the first column. The times are arbitrary (no equal spaced time interval needed), but the value must be in ascending order. Steps can be made by setting the same time for two adjacent points.
A data line can be followed by a comment that is started by asterisk (*). Pure comment lines must only be started by asterisk if the comment starts with a numeral. The file must be an ANSI or ASCII text file. Default name extension is .txt, but all other valid Windows extension are also accepted.
Sample file
| Created by Bruno Buesser, Feb. 27, 2003 |
| This file contains 3 output signals with 5 data points each |
| -1 ; 0.5; 0.6; 0.8 *Optional fictitious first point as initial value |
| 2.45; 1; 5; 8 *This is the first set of points. Time first then data. |
| 3.67; 2.5; 4.3; 6 *Second point. Time values are in ascending order. |
| 5 3.14 4.5 3.3 *The values are now separated by spaces |
| (>blank lines are skipped) |
| 6.23 2,5 4.1; 2,5 *Comma is also accepted as decimal separator |
| Lines which start not with numeral, point or comma are skipped |
| 8;0 3,8; 1.4 *That is the last set of points |
| * 5 sets of points are loaded >> * is mandatory, as the comment starts with a numeral |
| End of sample file |
The series are best edited in a spreadsheet (like Microsoft Excel) and then saved to an AINSI text file.
Note: The time space between two successive data points should be a multiple of the integration step size. If not, the integration step size should be less than half the space of two successive data points, otherwise signal filtering occurs (undersampling) that may distort the output signal. Check the output visually in case of doubt.